- Brokers HOT
- Scam
- BV Assessment NEW
- Rankings
- Regulators
- News
- Claims
- Expo
- Event
- Awards
 Search
 Download
 English
What Are The Most Powerful Candlestick Chart Patterns for Forex Trading

The method of candlestick pattern analysis has evolved to become one of the most popular technical analysis tools in the forex market. Traders of stocks and other financial markets also use candlesticks as a great visual aid to what a particular price has done within a certain time period.
Candlestick patterns are top-rated and essential tools in forex trading. Understanding them allows traders to interpret the changes that happen in the market and take actions from that information. In this article, we will show you five candlestick patterns that are still considered reliable as references for price direction and momentum.
What Is Candlestick Chart
Candlestick charts in trading are price charts that show trends and reversals, in which the prices are denoted by candlesticks. Candlestick charts are easy to read and are one of the oldest studies in technical analysis. They originated in Japan over 100 years before the bar and point and figure charts were developed in the western markets.
Candlesticks are formed by showing a candle “body”, a solid area between the open and close price, and “wicks”, which represent the high and low. Sometimes a solid candle can be formed when the open was the low and the close was the high, and thin candles with less of a solid body can be formed when a price is volatile and ranges a lot within the day.
Candlestick charts capture not only the link between the price and supply and demand but also the emotions of traders. The investors' emotion is highlighted by visually representing the size of price movements with different colours. A green candle is considered bullish as for that timeframe buyers are in control while a red candle is considered bearish as for that timeframe the bears or sellers are in control.
Five Most Powerful Candlestick Chart Patterns for Forex Trading
Let’s take a look at five of the most widely used candlestick patterns alongside some actual stock chart examples to show their worth.
1. Bullish And Bearish Engulfing
The bullish engulfing pattern is a two candle reversal pattern. After the first dark candle appears, a second larger and hollow one forms and engulfs the body of the first one. Usually this sort of pattern will tell a trader the price has moved down, found some support or buying volume, and then made a bullish move back up by breaking the previous day’s high. Often this type of candle can be the signal for a sustained upward move or trend change.
Likewise, a bearish engulfing candlestick pattern indicates a change of market trend, from an uptrend to a downtrend. It is a two-line pattern with the first candle being red followed by a green candle and the green candle’s body overlapping or engulfing the prior candle’s body, not including the shadows. This pattern formation at times leads to bullish continuation but is more of a bearish reversal pattern.
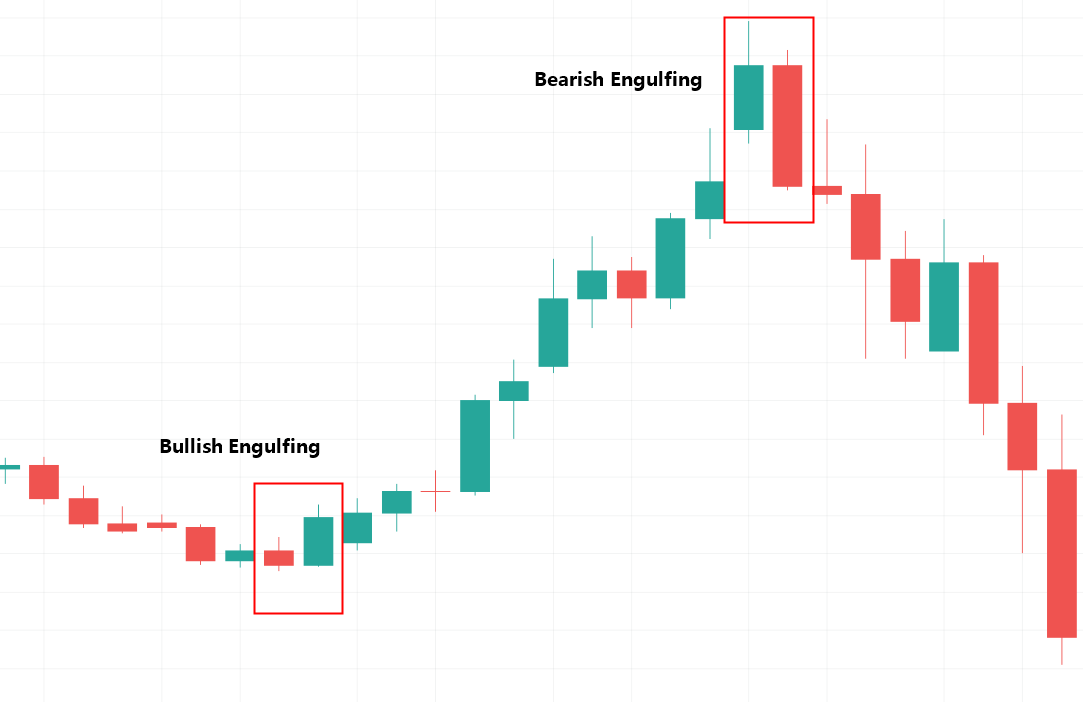
An important consideration is the location of where these engulfing patterns are situated in the context of an overall price trend. In the illustration above, it becomes evident that when these patterns are situated at the extremes of a price trend, they tend to have a bearing on where price is likely to head next.
2. Hammer Reversal Candlestick
As the name suggests, this candlestick resembles a hammer in shape. One of the simplest candlestick patterns, the hammer is made up of one candle with a long lower wick connected to a short body at the top of the candle.
Hammers signal a potential capitulation by sellers to form a bottom, accompanied by a price rise to indicate a potential reversal in price direction. This happens all during the one period, where the price falls after the open but then regroups to close near the open.

The chart shows a price decline followed by a hammer pattern. This pattern had a long lower shadow, several times longer than the real body. The hammer signaled a possible price reversal to the upside.
3. Doji Candlestick Pattern
There are times when the Forex candlestick is neither bullish nor bearish. Instead, it is a candlestick with short wicks and a negligible body. It takes the shape of a “plus” sign. The candlestick formed is called the Doji.
The pattern signifies uncertainty, indecision, and is waiting for either the bulls or bears to take control. Often the next direction is an upwards or downwards sustained move in price as the stock breaks beyond the Doji candle.

The positioning of the Doji is where its power lies. You could find a Doji almost anywhere on the charts, and every single position says something important about the currency pair. Wherever the Doji appears, know that the market could make a reversal or trend continuation on the next few candles.
4. Evening And Morning Star Candlestick
The Evening Star pattern is a three bar candlestick pattern that usually occurs at market tops and Morning Star pattern is a three bar candlestick pattern that occurs at market bottoms.
The Evening Star is a bearish and top trend reversal pattern that warns of a potential reversal of an uptrend. It starts with a long bullish bar carrying an uptrend to a new high. The market's gap is higher on the next bar, but it is suddenly short of fresh buyers, resulting in a small candlestick. The third candlestick confirms the turnaround of the price trend.
The morning star, on the other hand, happens at the bottom of a trend to suggest a reversal to the uptrend.

The small middle candle is the key to understanding why the evening star or morning star patterns suggest reversals. It shows that the market is temporarily hesitant about its next direction, whether uptrend or downtrend.
5. Three Line Strike
The bullish three line strike reversal pattern carves out three black candles within a downtrend. Each bar posts a lower low and closes near the intrabar low. The fourth bar opens even lower but reverses in a wide-range outside bar that closes above the high of the first candle in the series.

Conclusion
All in all, these five candlestick patterns, when identified correctly, can be extremely useful for investors. Although many believe that the patterns are starting to lose their accuracy in the modern forex market, several patterns are still reliable in predicting the price movements. That is why understanding candlestick patterns is still important for forex traders.
Let’s end this article with this: If the Forex charts told the stories of every currency pair, candles would be the words, and candlestick patterns would be sentences.


Hottest


©2018-2025 BrokersView EU Limited. All Rights Reserved.


Risk Warning:
FX trading is of high risk and may not be suitable for all investors. Leverage will create additional risks and loss. Before trading, please carefully consider your investment objectives, experience level and risk tolerance. You may lose part or all of your initial investment; do not invest money that you cannot afford. Educate yourself about the risks associated with FX trading. If you have any questions, please consult an independent financial or tax advisor. Any data and information are provided "as is" and only for information purpose, not for trading or recommendations. Past performance does not predict future results.
Disclaimer:
The data contained in this website may not be real-time and accurate. The data and prices on this site are not necessarily provided by the market or exchange, but may be provided by market makers, so prices may be inaccurate and differ from actual market prices. Namely, this price is indicative price only to reflect market trend, and is unfavorable for trading purpose. The provider of the data contained in the Website shall not be liable for any loss incurred by you as a result of your trading activities or reliance on the information contained in the Website.